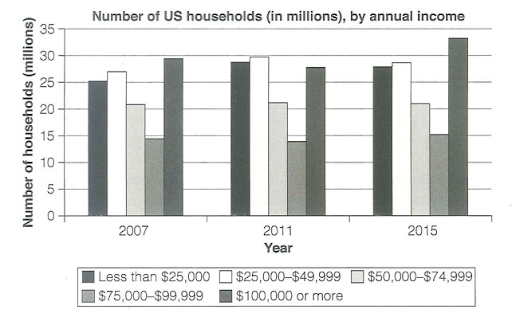
The bar chart compares the number of households categorized by annual income in the United States in three different years: 2007, 2011, and 2015.
Summarise the information by selecting and reporting the main features, and make comparisons where relevant.
Type your essay below and click Submit for evaluation
You have 20:00 minutes to complete Writing task 1. The timer will start when you start typing.
Words Count:
0
