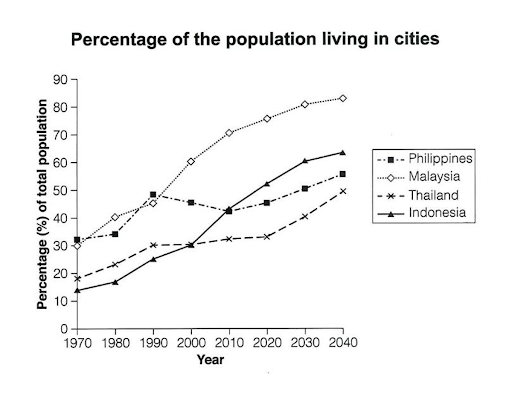
The graph below gives information about the percentage of the population in four Asian countries living in cities from 1970 to 2020, with predictions for 2030 and 2040.
Summarise the information by selecting and reporting the main features, and make comparisons where relevant.
Type your essay below and click Submit for evaluation
You have 20:00 minutes to complete Writing task 1. The timer will start when you start typing.
Words Count:
0
